

How to Make the Best use of Application Logging
How to Make the Best use of Application Logging
Edition #15

Hey, I'm Marco and welcome to my newsletter!
As a software engineer, I created this newsletter to share my first-hand knowledge of the development world. Each topic we will explore will provide valuable insights, with the goal of inspiring and helping all of you on your journey.
In this episode I want to show you how I use logs in my applications, the structure and a real debugging example.
Are you interested in learning how to implement a magic link authentication mechanism using JSONWebToken?
Sign up, I'll be publishing a post about it in the coming weeks!
👋 Introduction
Imagine you have a problem during production and need to figure it out. How do you start?
Debugging is essential for developers. Knowing how to get more info makes finding the real issue easier.
That’s where logging helps. It saves time by giving clear data. It’s not just for fixing bugs; it tracks user activity, usage levels, and service performance, making everything easier to handle and improve.
Since my initial experience, I have been obsessed with logs. Every morning, I check the log tool for errors from the previous day. If any errors are found, I create a task, prioritize it, and add it to the backlog.
I have worked in environments where logging was either overused or completely ignored. Having experienced both extremes, I can confidently say that when used effectively, logging can make a significant difference.
Dashboard
Logs can be organized and combined to make dashboards. These are helpful because they quickly show if something is wrong, like a drop in performance or a problem with an external service.
We can also set up alerts based on log data. Recently, I've been working on making sure that if there's an error in the application, it triggers an alert on AWS, which then sends a message to a dedicated Slack channel. This setup is great because it means I don't have to check logs all the time; they let me know about issues automatically. (pull vs push)
There are different tools you can use to store and show log data. Over time, I've used several popular ones, including:
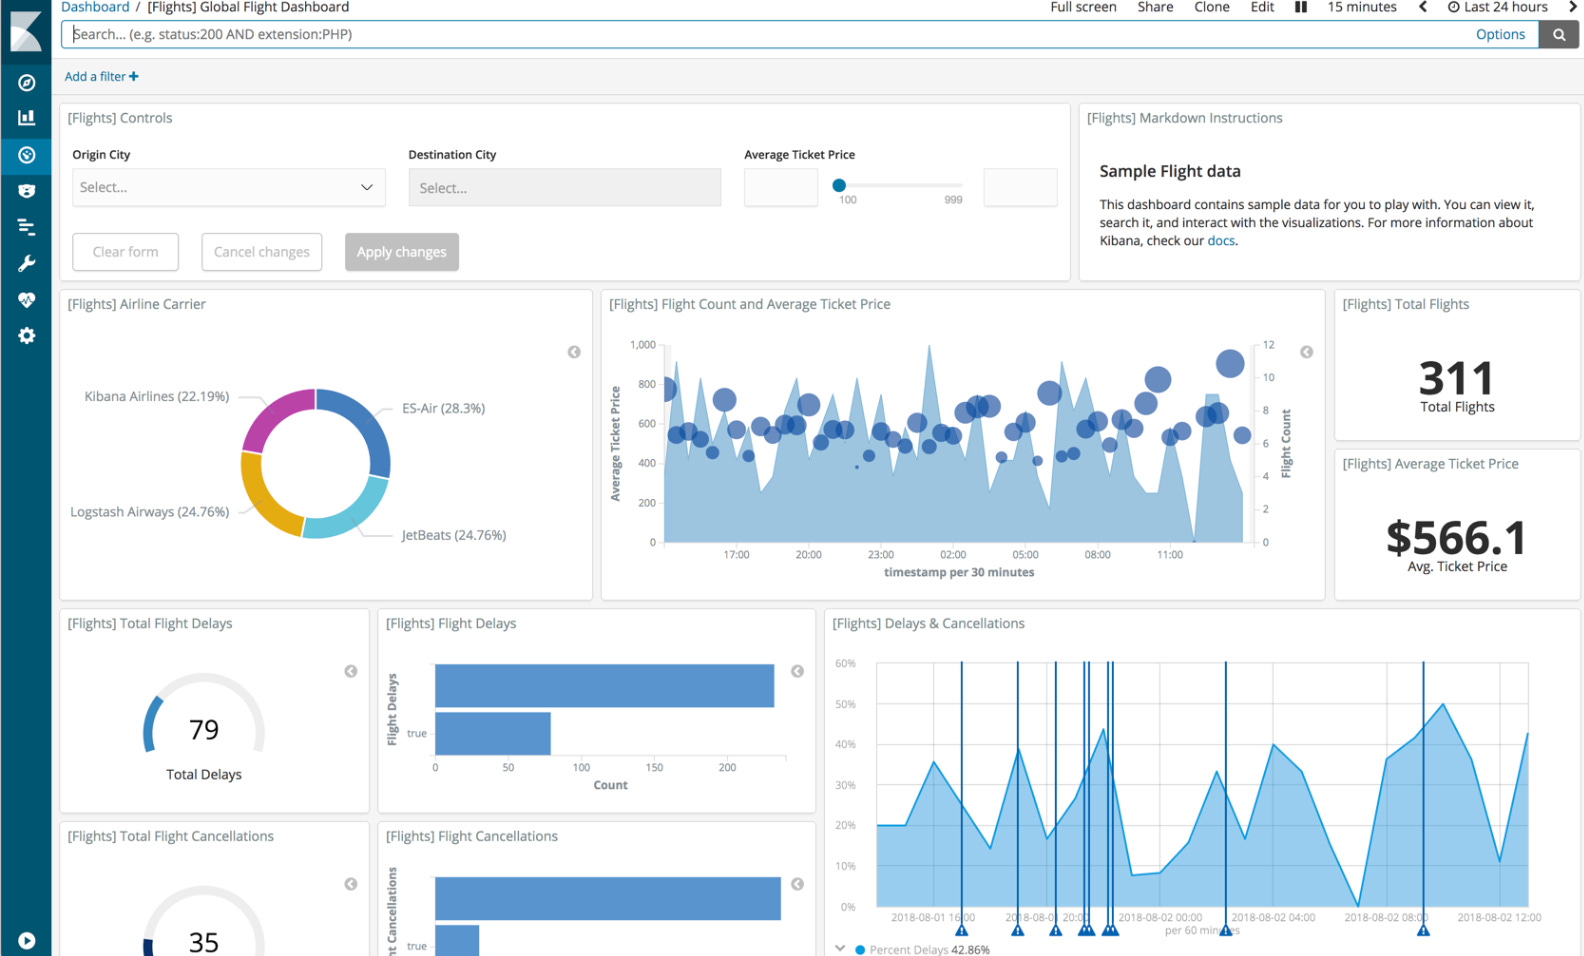
Kibana
it is a tool that helps to see and understand the data. It works very well with Elasticsearch. You can use it to create charts, maps and dashboards from the data stored in Elasticsearch. It is very useful to get insights and keep an eye on trends and important numbers in one place. Both proprietary and self-hosted solutions are available, so you can choose the one that is right for you.
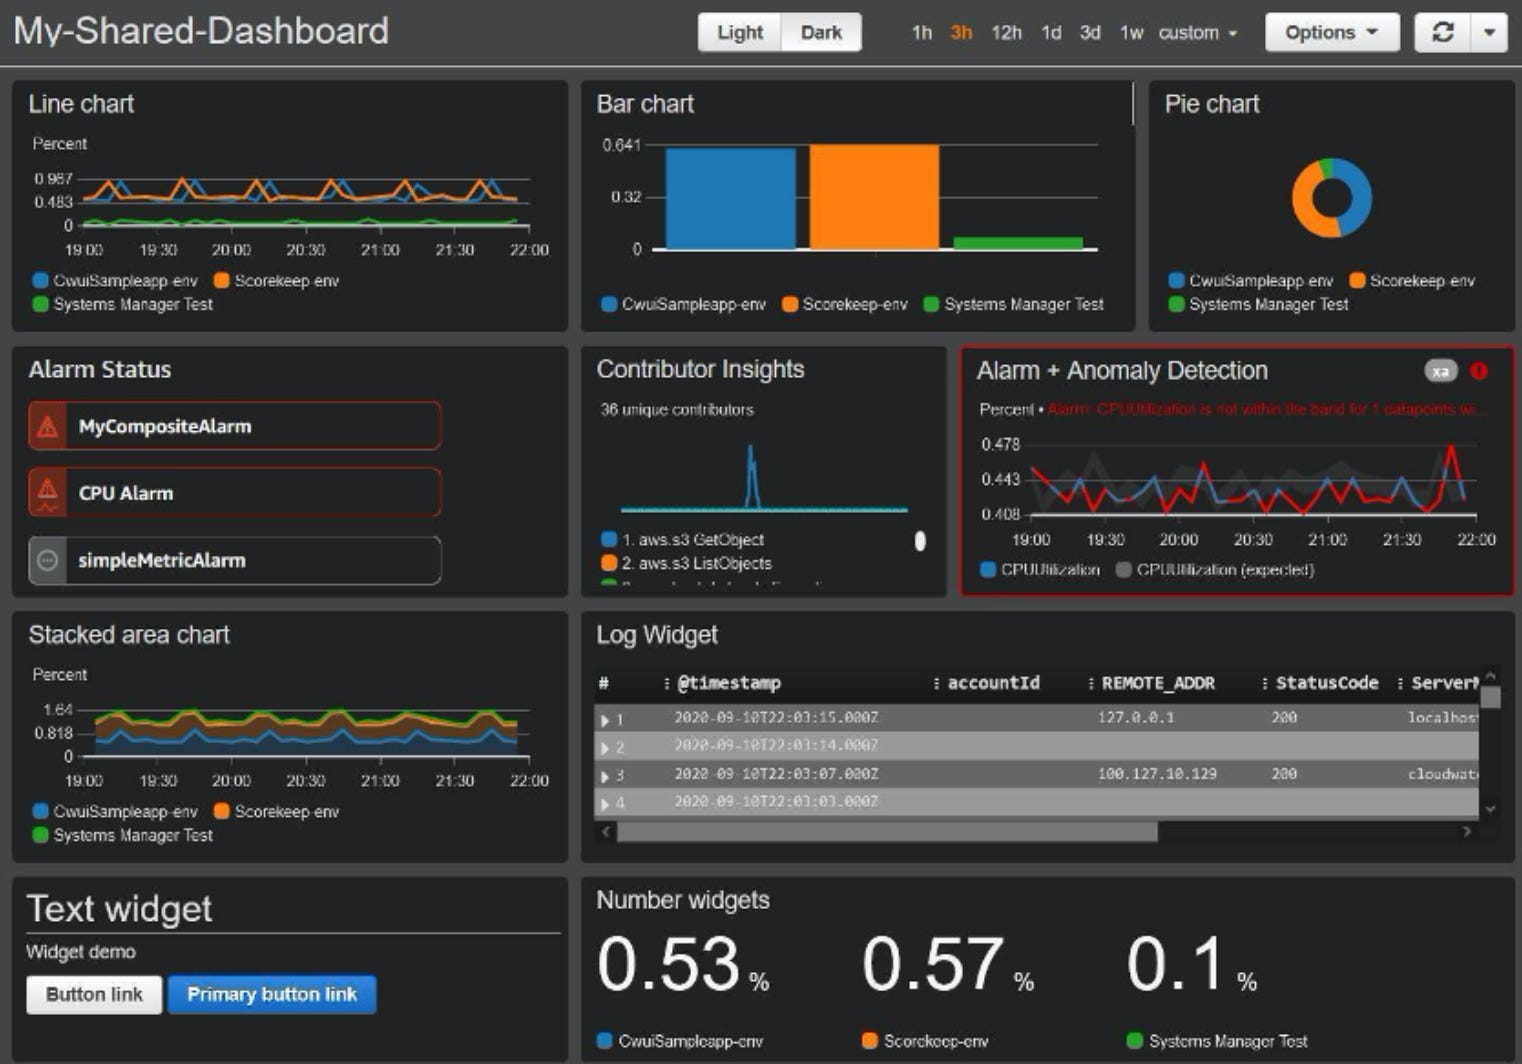
AWS Cloudwatch
is an AWS service for monitoring and managing your AWS resources. It tracks metrics, monitors log files, sets alarms, and triggers automated actions. It's essential for gaining insights into resource performance, optimizing AWS usage, and ensuring operational health across your AWS environment. It’s a proprietary solution.
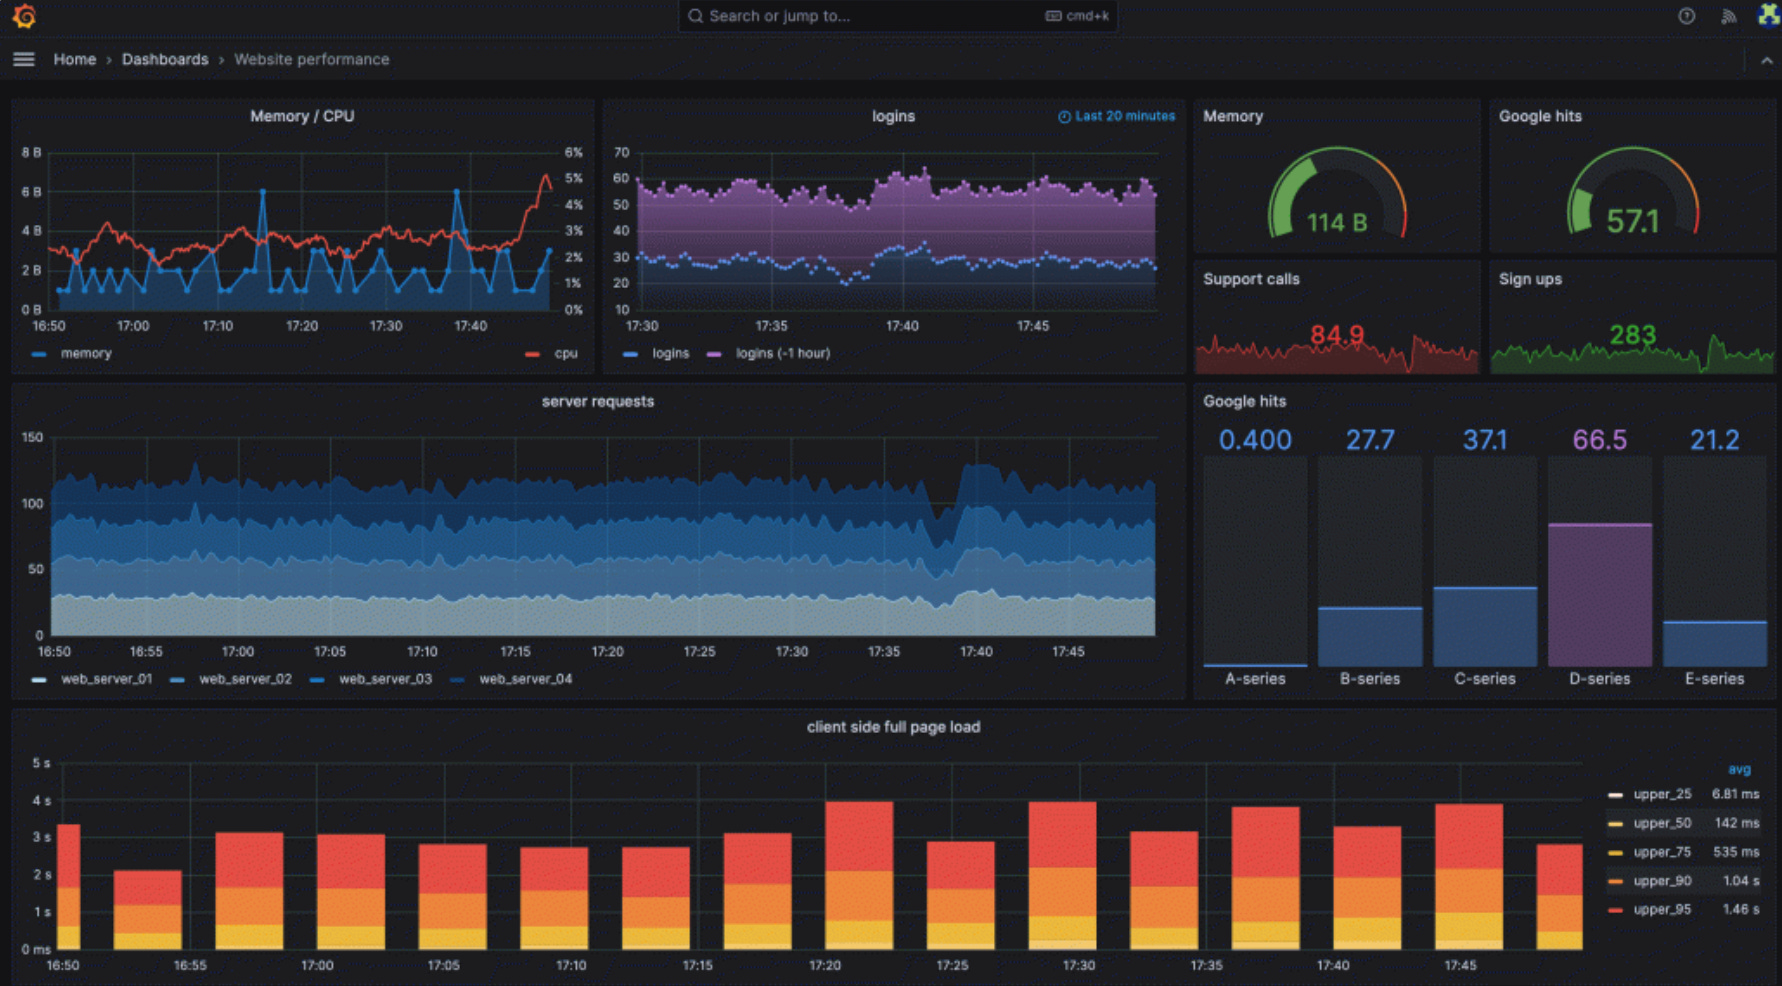
Graphana
Grafana is a tool for visualizing data and monitoring systems. It works with different data sources like Elasticsearch and Prometheus. You can create custom dashboards and charts to track real-time data easily. Grafana is popular for monitoring performance metrics, applications, and business data, making it a valuable tool for data analysis and insights.
💡 My solution
In my Node.js applications, I handle logging in this way:
console.log wrap
There are many libraries available for logging in Node.js. In my case, I chose to create a log.js module that wraps console.log to avoid unnecessary dependency. This module handles JSON serialization correctly and adds a "transaction-id" prefix, which is a unique ID for each API call. This makes it easier to filter logs and view only the logs for a specific execution.
The transaction ID is generated in the first middleware when an HTTP call is made, it’s stored in async storage for later use and returned in the response header “x-transaction-id“.
Are you interested in how I made this module? You can find it in this file of my Node.js backend template.

print a log on each method with all input parameters
static getByPath = memoize(async (path) => {
  log.info('Model::Post::getByPath', {path})

  const rows = await query(`
      select *
      from posts
      where path = ?
  `, [path]);

  if (rows.length !== 1) throw new APIError404('Post not found.')

  const post = Post.fromDBRow(rows[0])

  return post
},
{
  promise: true
})
I can analyze API invocations with a full context of what happened. However, this approach could lead to a waste of resources, especially with large arrays or objects. It depends on the situation, typically, I like to identify the problem before solving it. In this scenario, I might print a partial view of the object.
🧩 Log structure
For each HTTP call, I display the following logs:
Log showing the HTTP method and endpoint called
Curl command to replicate the invocation locally
Log for each SQL query executed
Log for each external service invoked
Zero or more logs from executed modules like controllers or models
End of execution log
Summary log of the invocation, including useful information about execution time, returned response, API version, etc.
Here is an example:
[FnE4hKQlXf] INFO Started GET for /posts/get-url-by-path params => {"path":"quickview"}
[FnE4hKQlXf] CURL http://localhost/posts/get-url-by-path?path=quickview
[FnE4hKQlXf] INFO Controller::Post::getPostUrlByPath params => {"path":"quickview"}
[FnE4hKQlXf] INFO Model::Post::getByPath params => {"path":"quickview"}
[FnE4hKQlXf] QUERY select * from posts where path = "quickview" limit 1
[FnE4hKQlXf] INFO End GET for /posts/get-url-by-path
[FnE4hKQlXf] KOA {"time":"2024-03-19T05:30:59.779Z","timestamp":1710826259779,"name":"hackernews-automation","version":"1.0.0","ip":"::1","method":"GET","url":"/posts/get-url-by-path?path=quickview","status":200,"bytes":"78B","duration":"376ms","id_transaction":"FnE4hKQlXf","result":{"url":"https://implementing.substack.com/p/how-i-made-quickview-my-ai-based"}}
Exceptions
If an unexpected error occurs, the entire stack trace is logged, which is very helpful in understanding where the issue occurred.
[jjlkQNWN0v] INFO Started GET for /posts/get-url-by-path params => {"path":"error"}
[jjlkQNWN0v] INFO Controller::Post::getPostUrlByPath params => {"path":"error"}
[jjlkQNWN0v] INFO Model::Post::getByPath params => {"path":"error"}
[jjlkQNWN0v] ERROR Error: Unexpected error
    at getByPath.memoize.promise (file:///Users/marcomoauro/workspaces/personal/hackernews-automation/src/models/Post.js:30:13)
    at Post.getByPath (/Users/marcomoauro/workspaces/personal/hackernews-automation/node_modules/memoizee/lib/configure-map.js:60:41)
    at getPostUrlByPath (file:///Users/marcomoauro/workspaces/personal/hackernews-automation/src/controllers/post.js:9:27)
    at file:///Users/marcomoauro/workspaces/personal/hackernews-automation/src/middlewares.js:63:26
    at dispatch (/Users/marcomoauro/workspaces/personal/hackernews-automation/node_modules/koa-compose/index.js:42:32)
    at /Users/marcomoauro/workspaces/personal/hackernews-automation/node_modules/@koa/router/lib/router.js:423:16
    at dispatch (/Users/marcomoauro/workspaces/personal/hackernews-automation/node_modules/koa-compose/index.js:42:32)
    at /Users/marcomoauro/workspaces/personal/hackernews-automation/node_modules/koa-compose/index.js:34:12
    at dispatch (/Users/marcomoauro/workspaces/personal/hackernews-automation/node_modules/@koa/router/lib/router.js:428:31)
    at dispatch (/Users/marcomoauro/workspaces/personal/hackernews-automation/node_modules/koa-compose/index.js:42:32)
[jjlkQNWN0v] INFO End GET for /posts/get-url-by-path
....💾 Where I store the logs
For my deployed applications, I always rely on Heroku's Papertrail add-on, which offers a free plan that is perfect for smaller applications.
You can find more details in this post:

👨💻 Let’s get down to practice
Let's consider a scenario where someone has reported an error in an API within our system that occurs every time it is called.
We are referring to the API used in the automation I developed for my posts on HackerNews.

Open the frontend at https://g6fghrfw3t34z.netlify.app/elasticsearch and look at the dev tool:
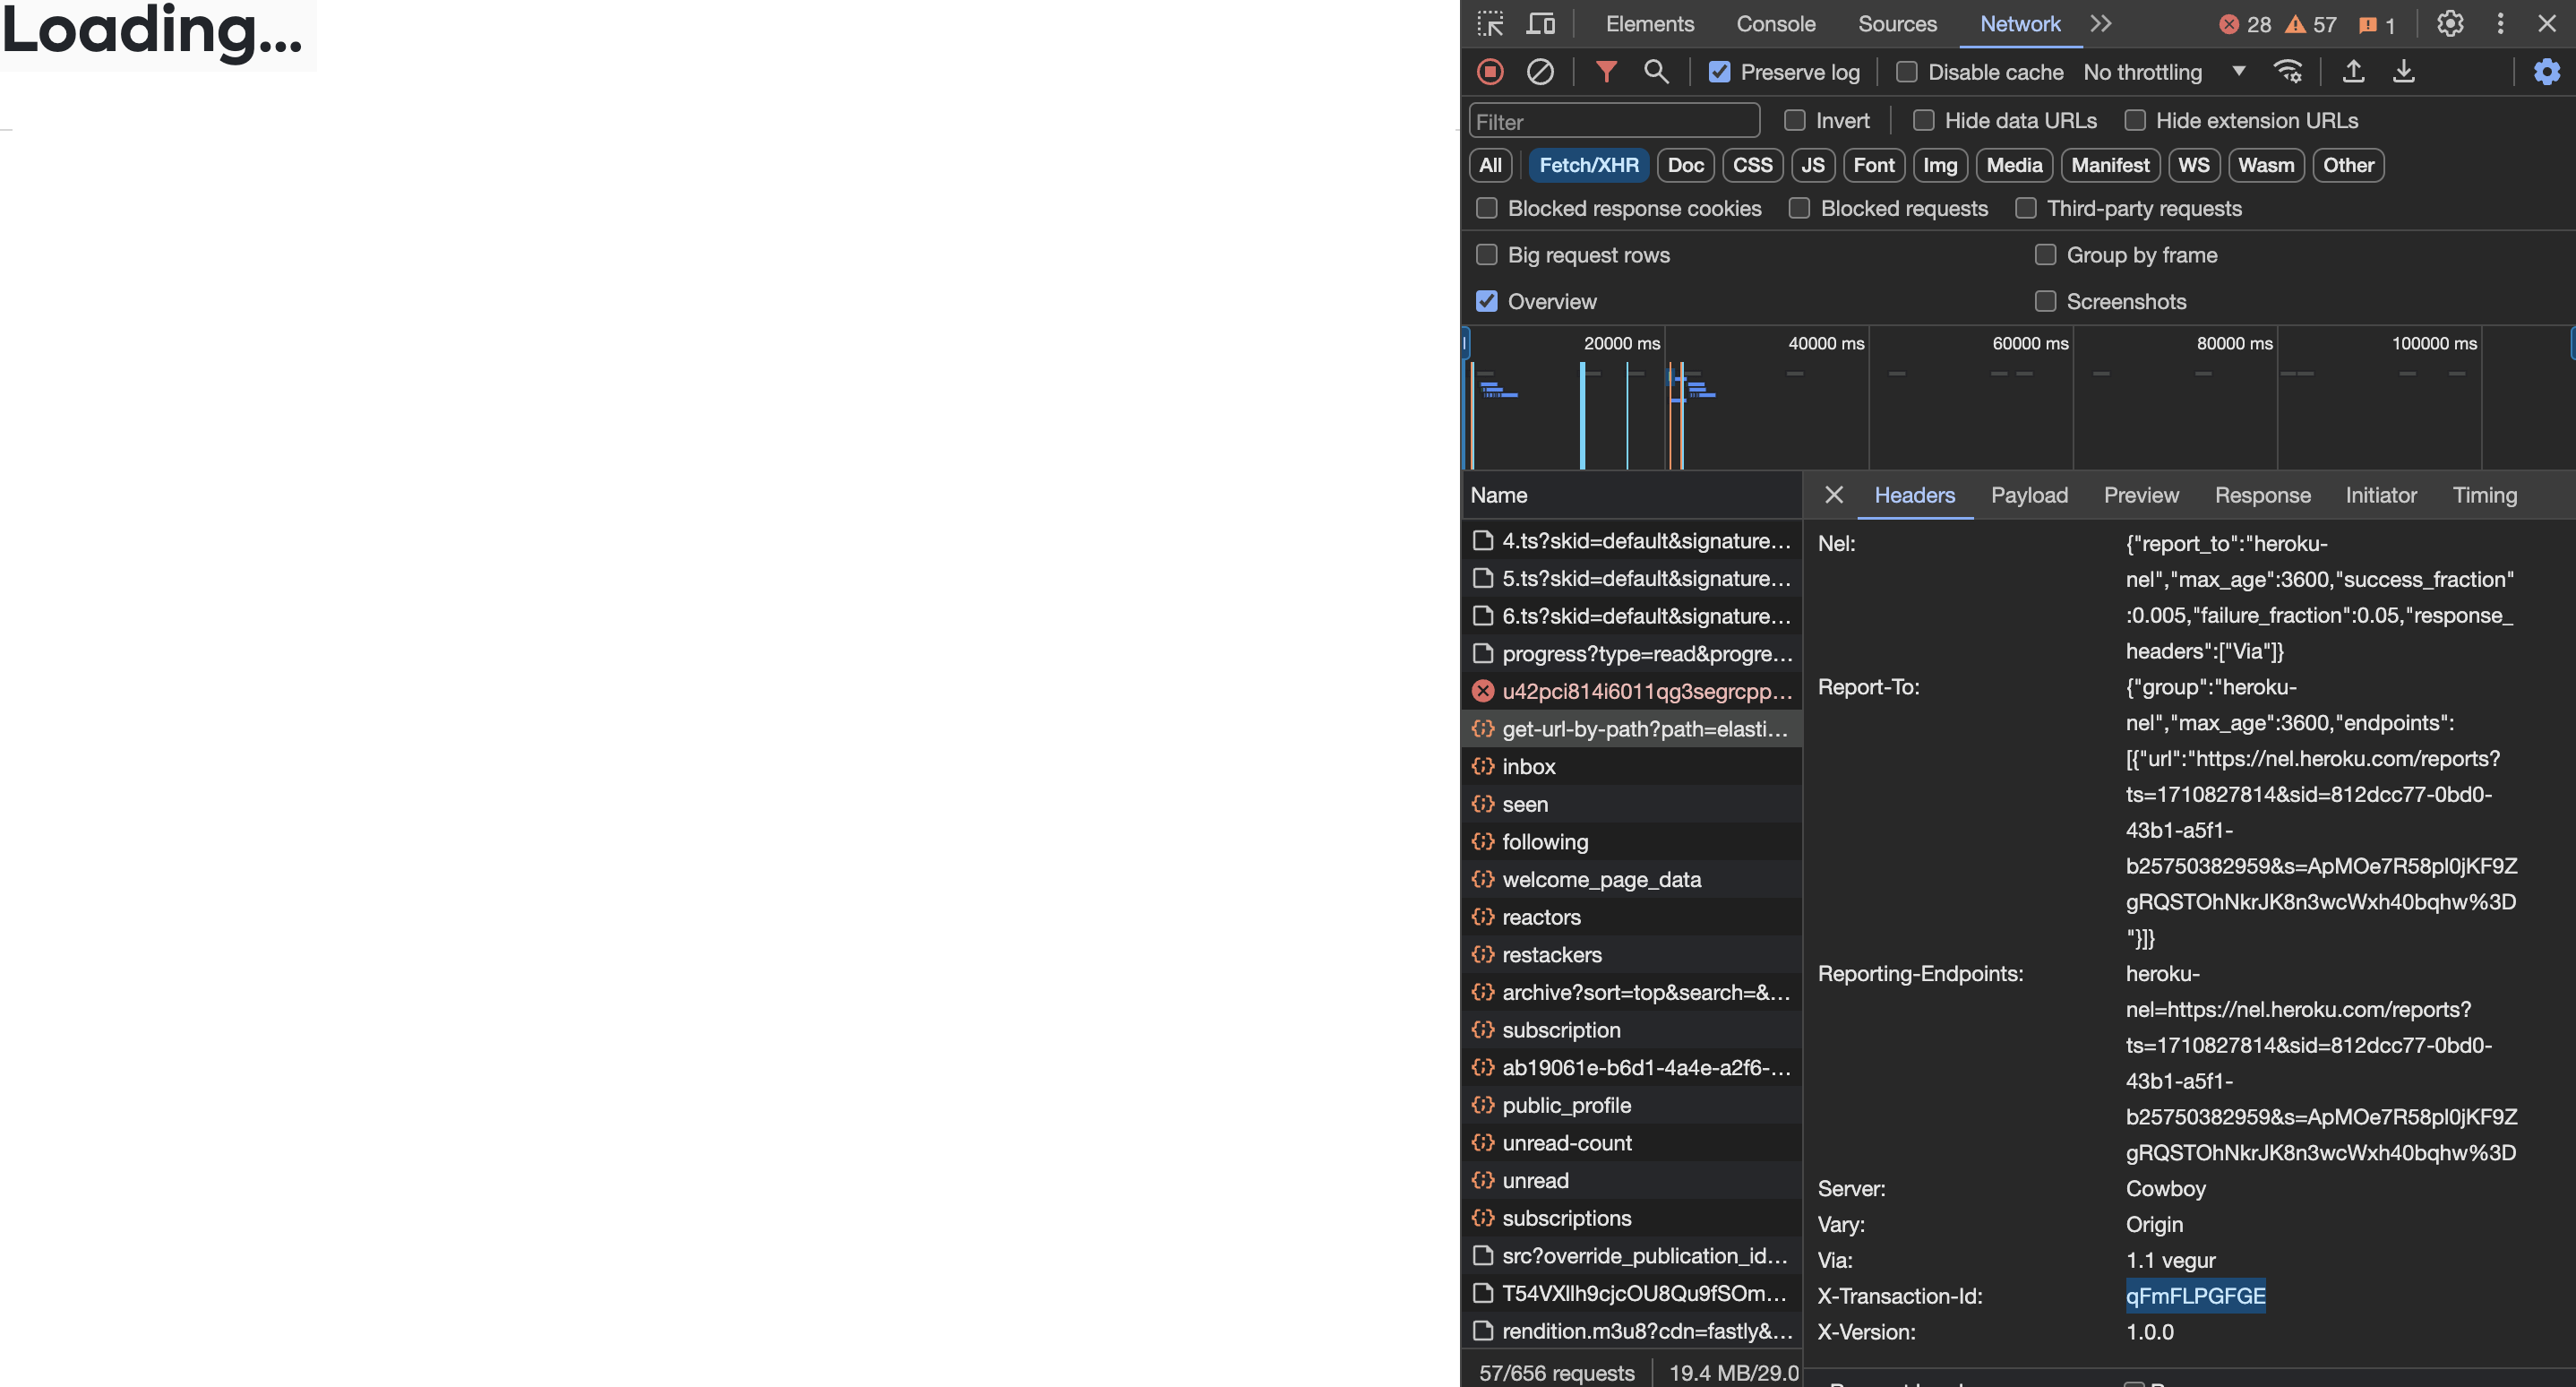
We observe that the frontend called the backend API at https://hackernews-automation-be6a1b70f48a.herokuapp.com/posts/get-url-by-path?path=elasticsearch, which successfully responded and included the transaction ID qFmFLPGFGE in the headers.
Next, let's navigate to Papertrail:
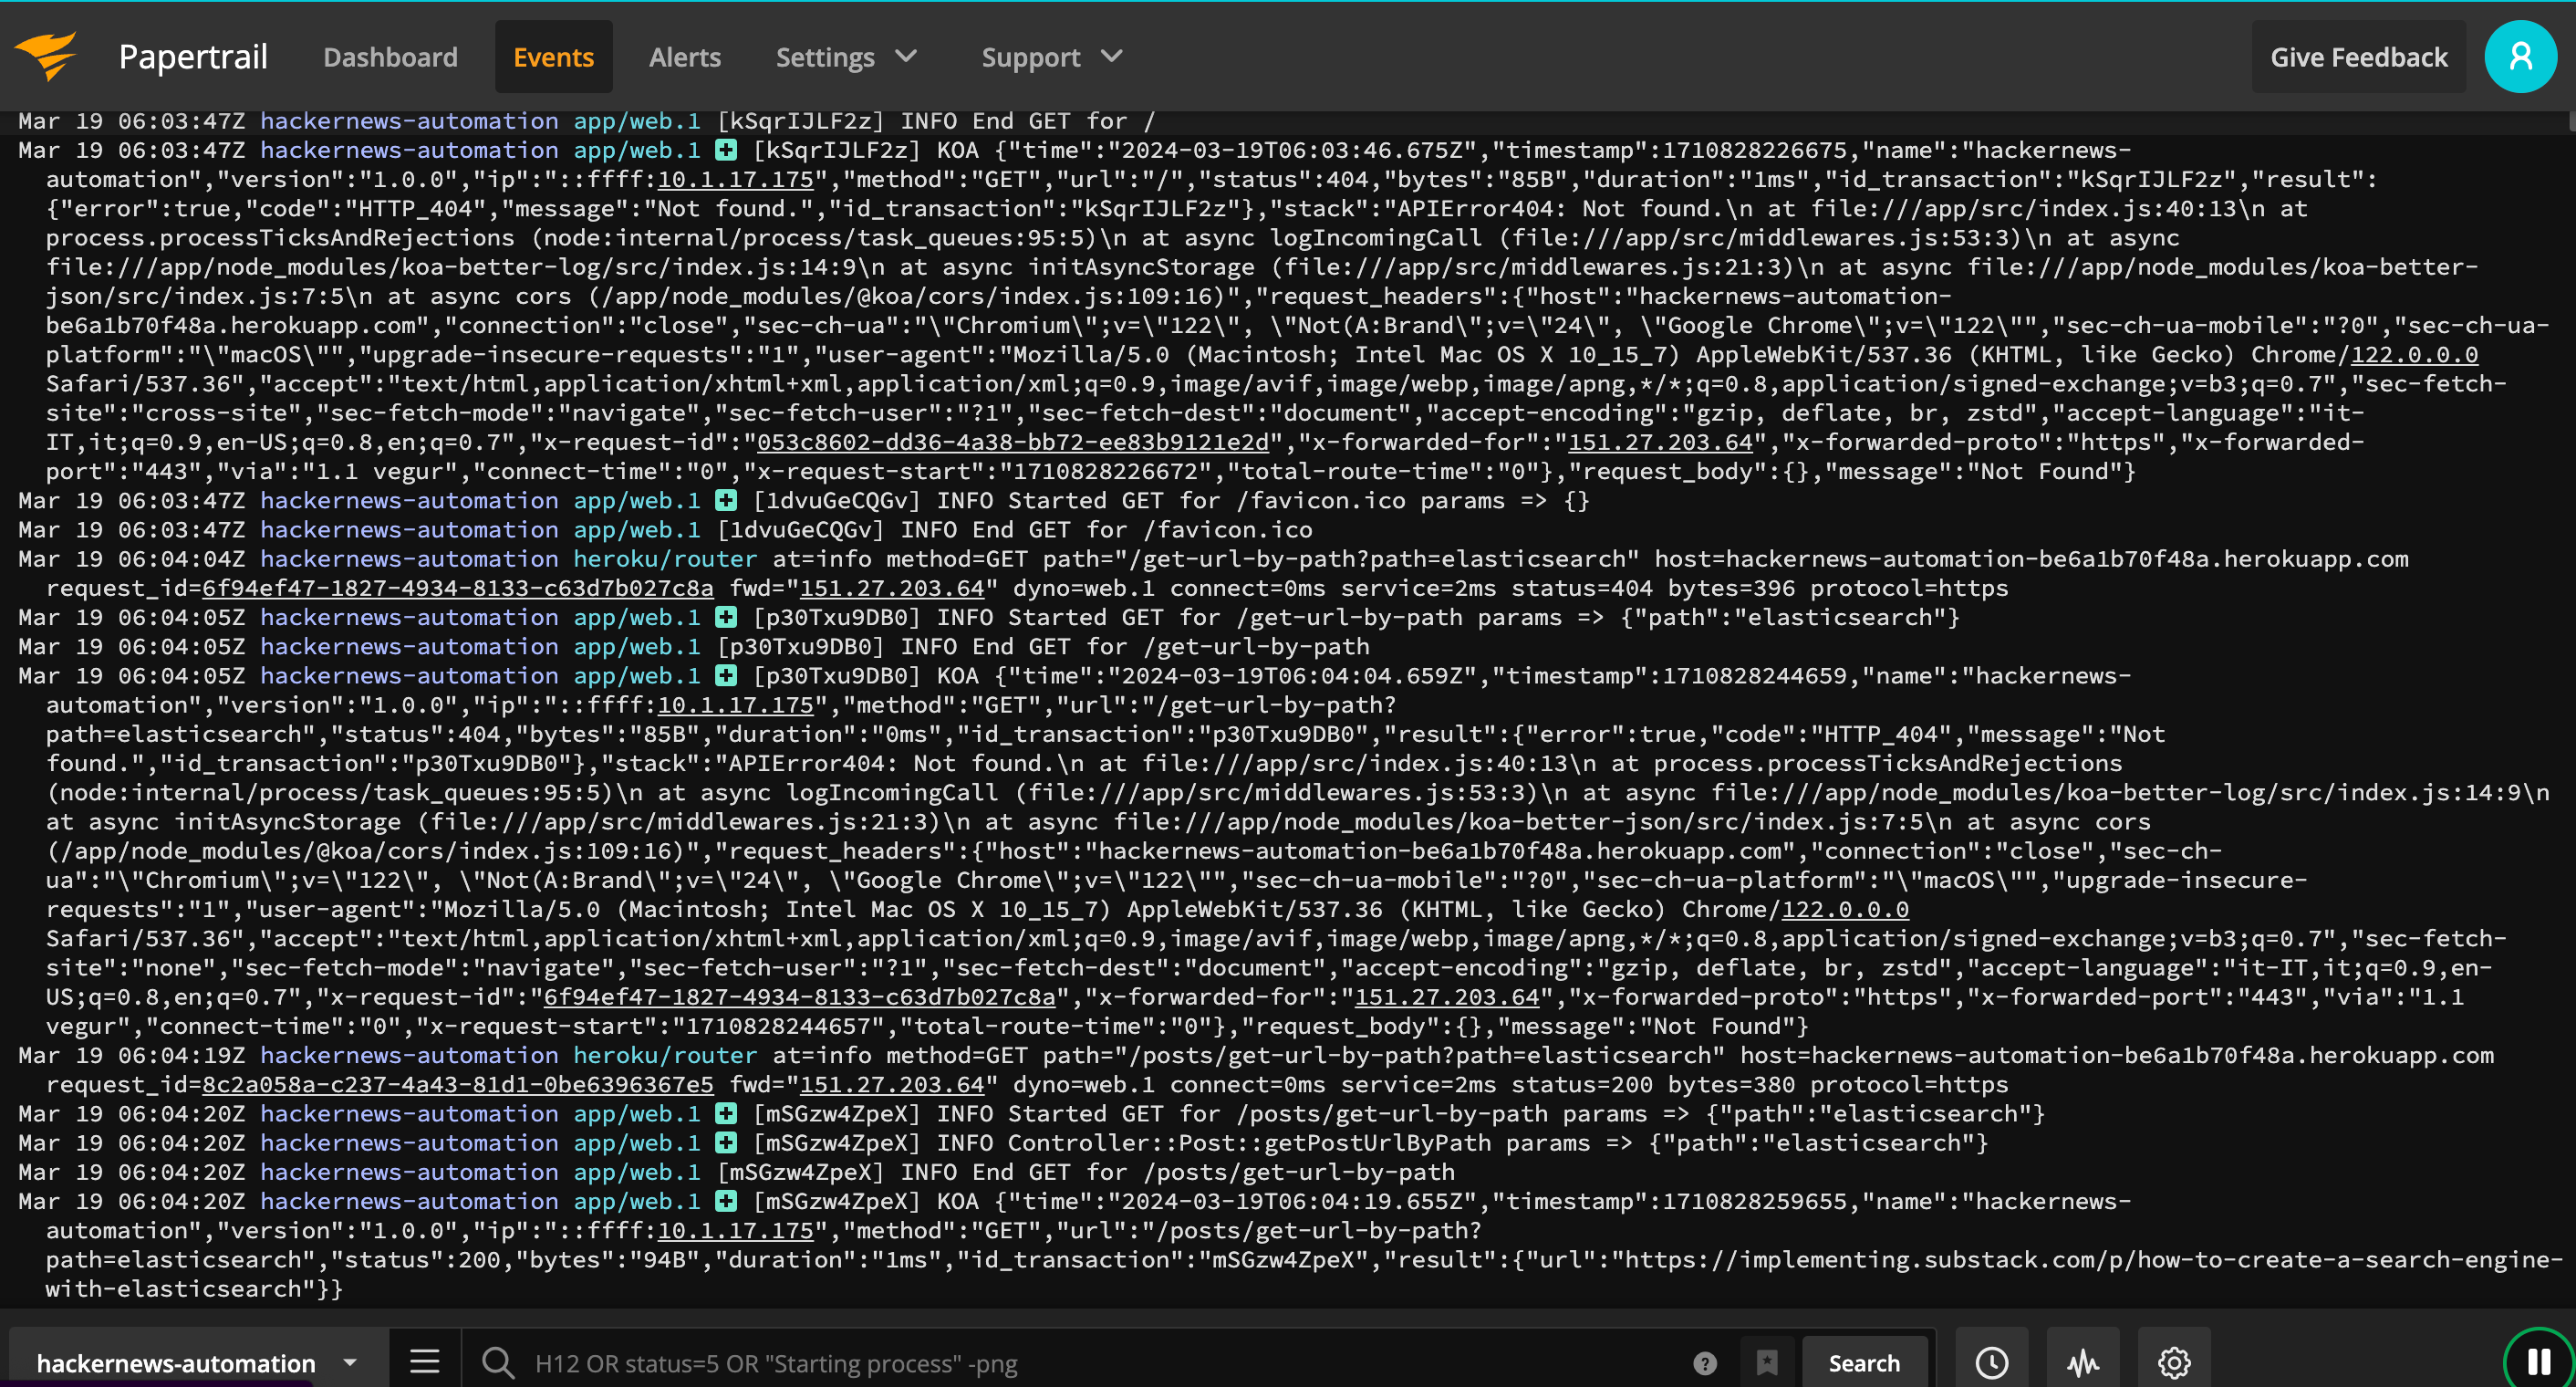
By filtering for the string "qFmFLPGFGE," we can view only the logs corresponding to the single API execution:
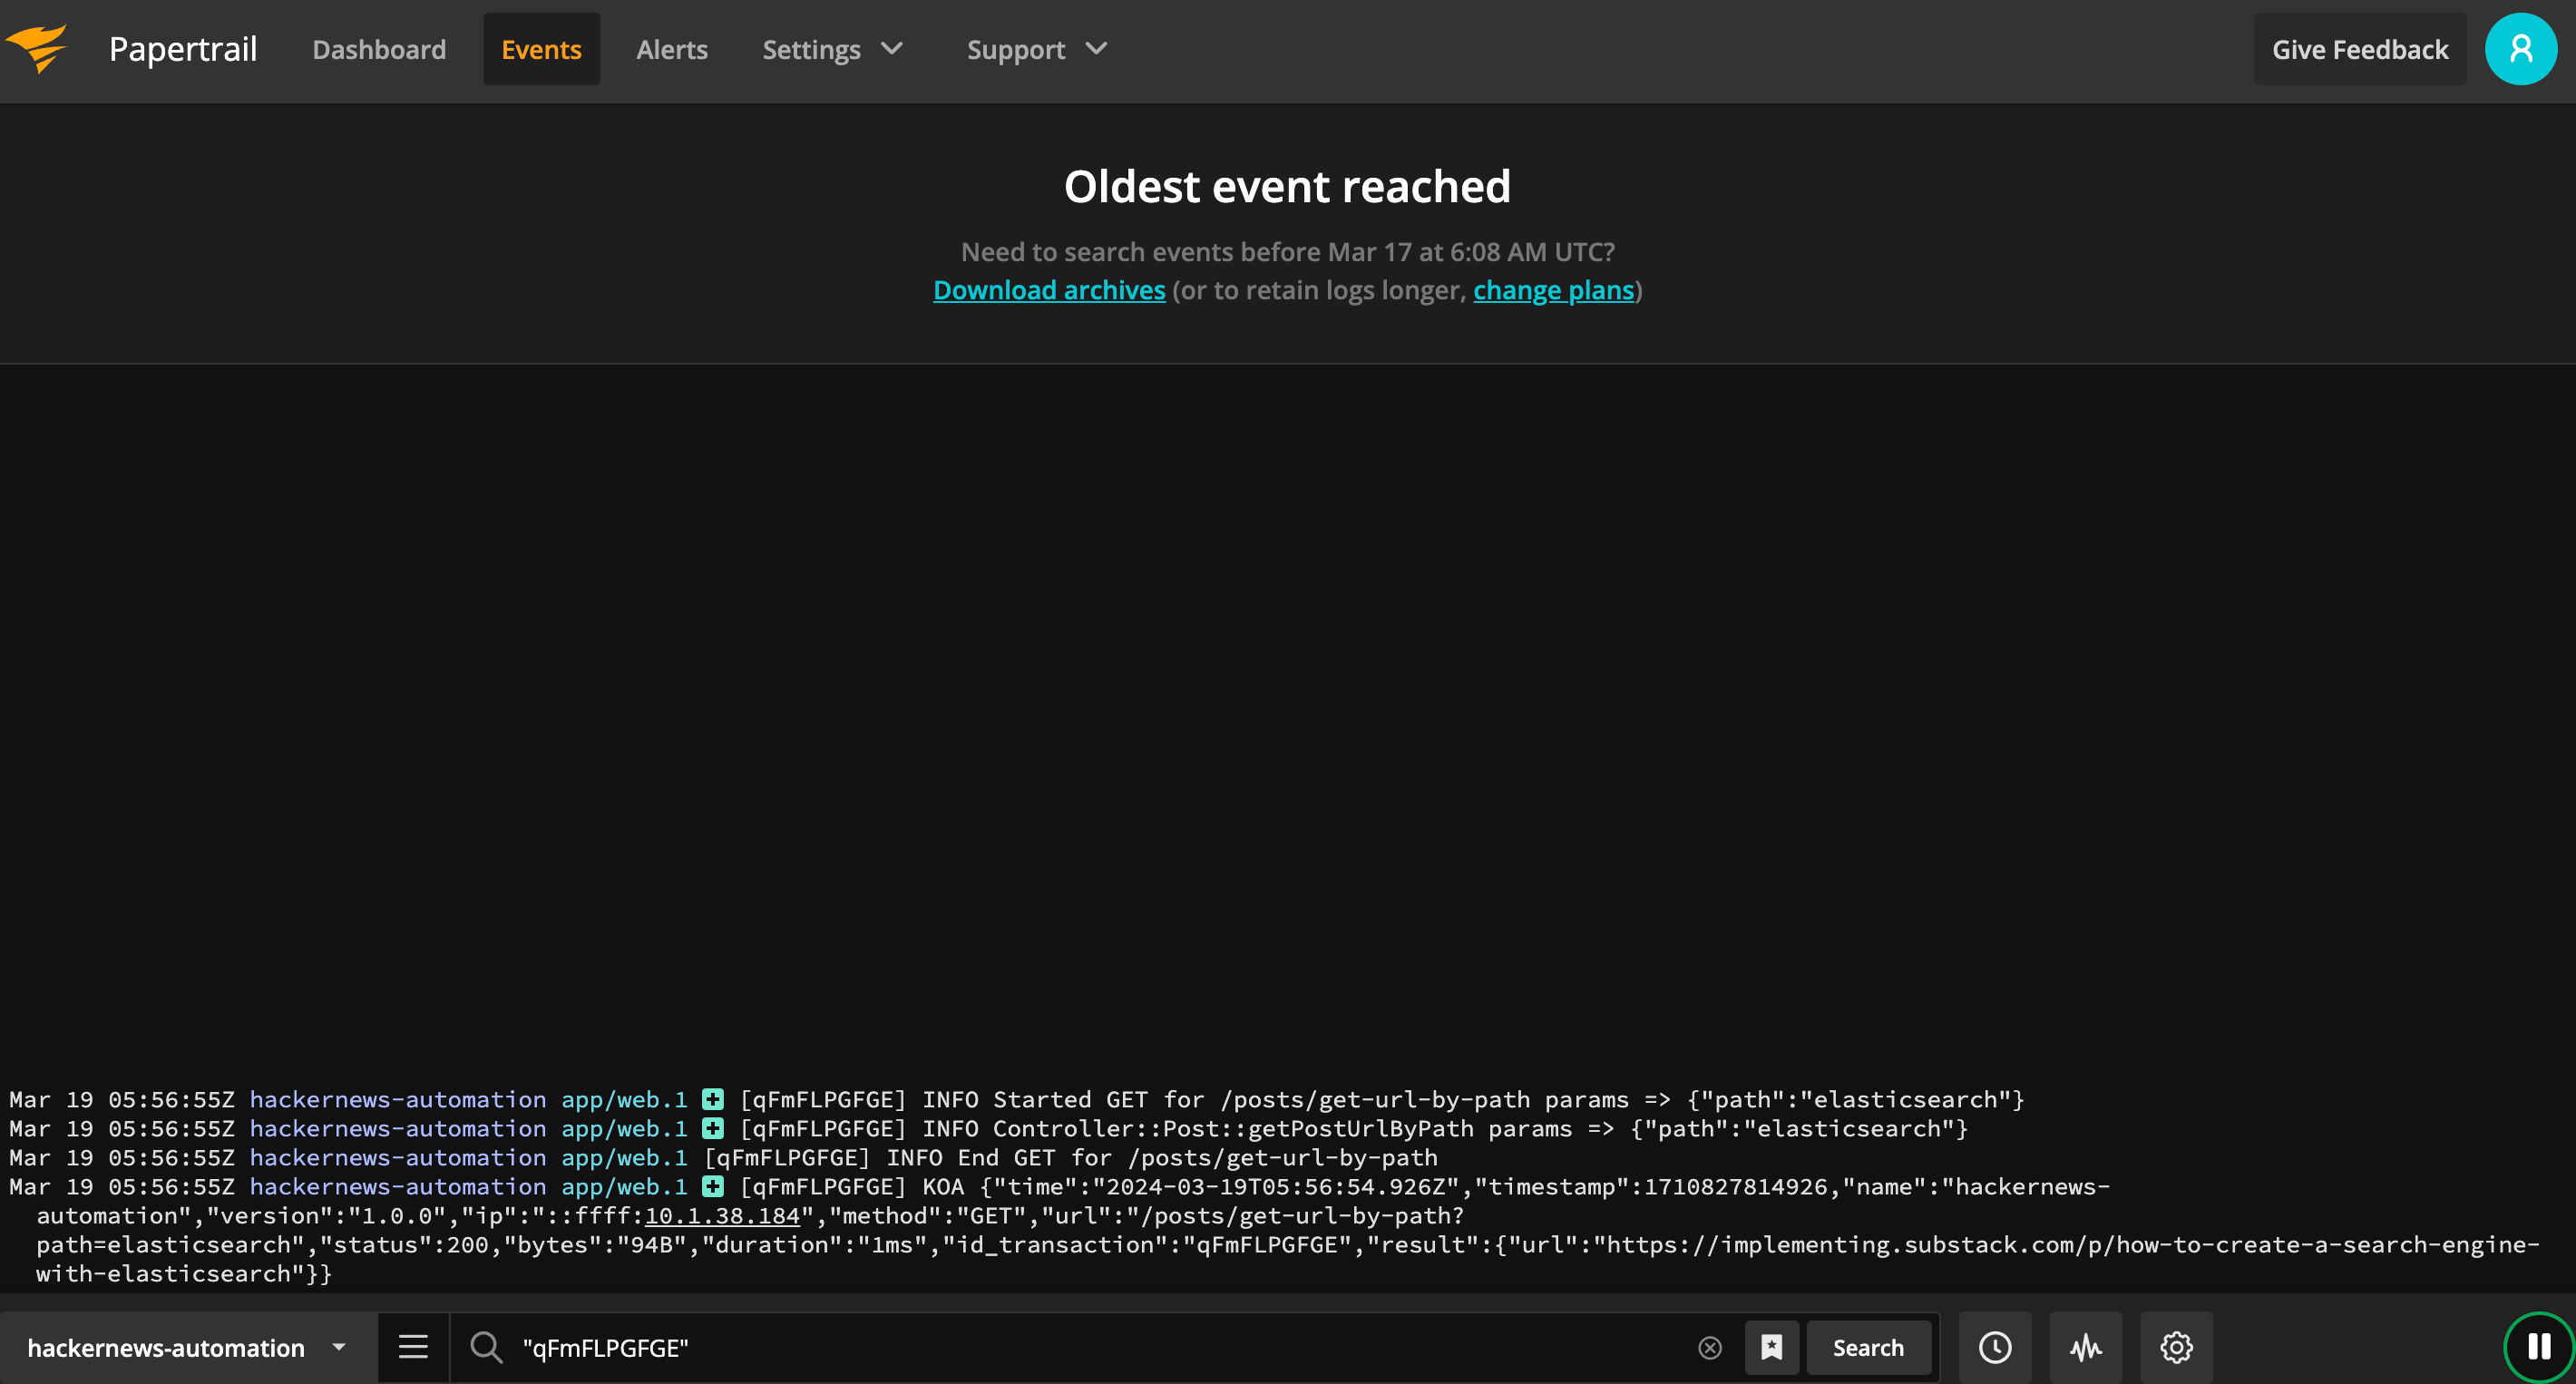
If there were any issues, we would promptly identify them and work towards resolving them!
🌟 Top lectures of the week
Forget code coverage! Use Mutation Testing
"I Need Help" Shouldn't Be Your First Outreach
And that’s it for today! If you are finding this newsletter valuable, consider doing any of these:
🍻 Read with your friends — Implementing lives thanks to word of mouth. Share the article with someone who would like it.
📣 Provide your feedback — We welcome your thoughts! Please share your opinions or suggestions for improving the newsletter, your input helps us adapt the content to your tastes.
💬 Chat with me — If you have any doubts or curiosity, please write to me, I will be happy to answer you!
I wish you a great day! ☀️
Marco
Logging has always been my favorite topic and I pay extra attention when writing/reviewing code towards logging.
I like to believe logging should be a standard library shared across an entire organization and surrounding application ecosystem.
Great content!
Also thanks for the mention 💙